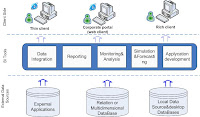
In the past, for the purpose of analyzing enterprises business data it was often used different statistic packages (such as, MS Excel), or specialized custom- made applications.
Typically, the development of such solutions was not on an industrial basis. These solutions were difficult to integrate, maintain, and develop.
In some time had come the understanding of the need for specialized tools to analyze business data, that is now called the Business Intelligence tools or BI
Now BI applications are the most popular tools for analyzing business data. Among the prerequisites of the wide spread of BI we can mention the following:
1.Improving Business Performance - Fast obtaining information necessary for decision-making. Using the accumulated data previously collected by ERP-systems
2. Geting new competitive advantages – Reducing uncertainty of the business environment - Applying modern tools of monitoring, analysis and prediction.
Modern BI applications develop in the following areas:
1. Modular approach to system architecture, open interfaces (including service-oriented architecture (SOA)) and ability to work with a wide range of data source types.
2. Support for a wide range of functional and analytical capabilities, as well as configuration flexibility, performance, stability, security and scalability of software.
3. Using the advanced features of data visualization, which helps the understanding of the meaning and perception of information.
| Sector | Objectives |
| Public sector, government | • analysis and control of financial and budgetary processes • analysis and modeling of tax revenues • analysis and revenue planning • analysis and forecasting of budget revenues • monitoring and modeling of inter-budgetary relations |
| Banking and financial organizations | • management and risk analysis • Attracting and retaining customers • detection of fraud •forecasting of financial indices, etc. |
| Enterprise | • monitoring and forecasting of current production,investment,financial and billing situation • a comprehensive analysis of financial and economic condition and performance of divisions #8226; assess the effectiveness of management decisions • budgeting. |
Common BI application architecture
Figure 1 (not ready yet)
Requirements for data integration tools:
• Data access by ODBC, OLE DB, OLE DB for OLAP, etc.
• Management of background and reference information (master data)
• Data warehose management , including «top-down» and «bottom-up» design
• Data extraction, transformation and loading (ETL)
Features of data integration tools:
• Loading data from external sources
• Harmonization of data
• Data transformation (aggregating in the necessary analytical slits, the calculation of indicators, etc.)
• Support of the chronological accumulation of information, etc.
Requirements for the reporting tools and data mapping:
• Building routine reporting
• Adhoc query and reporting
• A library of data visualization components: text, spreadsheet, cartograms, speedometers, scorecards, etc.
Peculiarities of the formation of reporting and data mapping:
• Reporting forms design
• Delivery of reporting forms to users who is interested in them in the required form
• The availability data mapping tools to provide data in business terms
Requirements for monitoring and data analysis tools:
• Design of analytic dashboards - a combination of mapped data, indicators navigation on the basis of metadata, the possibility of interactive work
• Formation of scorecards - an intuitive visual representation of important business information, including variances of key performance indicators
Features of the monitoring and analysis:
• Ability to create instrumental analytic dashboards and scorecards for visualization of key performance indicators (KPI)
• Mechanisms for notification and warning of the indicators exceed the target boundary
Requirements for modeling and forecasting tools
• Solving problems of econometric modeling on the basis of mathematical and statistical methods
• Expert system tools
• Research analysis based on the means of data mining (including the neural networks, decision trees, a system of of similar cases, genetic algorithms, etc.)
Features of modeling and forecasting:
• Investigation of the deviations of the business process of the targets (the answer to the question «Why?»)
• Forecasting the further development of business process based on the experience of its operation (the answer to the question «What will be?»)
• Finding the way to achieve the targets (the answer to the question «How?»)